Other Process Management Tools
Cryopreservation pathway development is only one component of building a germplasm repository. Repositories require a database with a public-accessible interface, trained personnel, specialized equipment, and supplies to function properly. Repositories must also have the capability to interact with their communities by sending and receiving samples. This makes integrating repositories into the communities of interest a complex task that requires analysis of many interacting resources. While process flow diagrams are an appropriate tool to understand processes such as cryopreservation, different tools are needed to understand repository-community interactions. Relationship diagrams depict the interactions between different members of a system and the flow of materials and information among those members (Damelio, 2011). These diagrams are used to display what resources (inputs) a facility uses and what products (outputs) the facility produces as well as how those inputs and outputs move throughout the network. These diagrams can be used to outline how the repository facility must operate to meet the needs of its community.
To create a relationship diagram for repository-community interactions, all activities and components involved at a repository facility must be first identified. For example, when making a relationship diagram of a repository that serves catfish farmers, activities would include cryopreservation, spawning, raising fish, as well as cleaning tanks, and the components needed would be personnel, equipment, and supplies. The components should be represented inside the repository building icon in the center of the relationship diagram (Figure 4). Next, the list of activities can be used to identify all the groups the repository interacts with, such as farmers, suppliers, and regulatory bodies. These groups would form the repository community and should be placed around the repository on the diagram. The type of repository model (central facility, mobile laboratory, or aggregate throughput) should be identified so that the diagram can depict how the repository and community interact (Liu et al., 2021). The repository should be connected (via arrows) to each community member by the materials and information they exchange. For example, the repository would receive live fish and germplasm samples from farmers, therefore, the relationship diagram should reflect that interaction. Finally, after all interactions have been outlined on the diagram, quantitative information can be added, such as indicating how many frozen samples the repository distributes to farms each year.
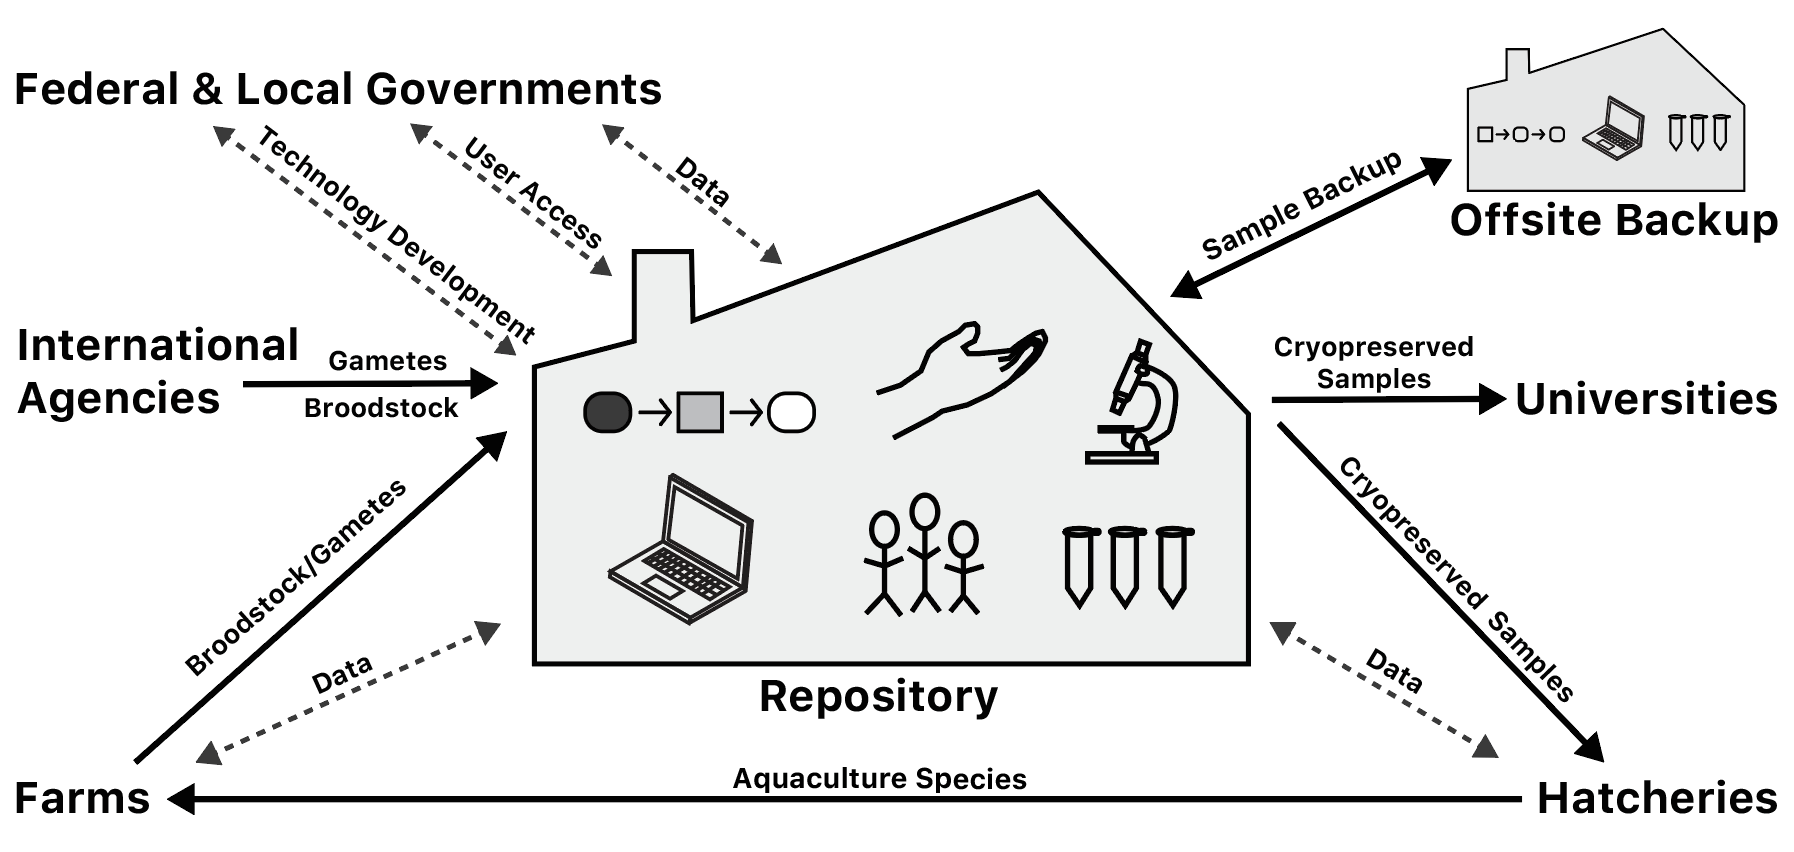
Figure 4. A generalized relationship diagram that encompasses all activities that take place at a central repository facility (building in the center) and the immediate interactions between the central repository and its surrounding community. Symbols within the repository represent six key repository components (from left to right): a simple pathway diagram represents the cryopreservation pathway, the open hand represents community outreach programs, the microscope represents specialized equipment, the laptop computer represents a database and data management, the people represent repository personnel, and the microcentrifuge tubes represent supplies. Solid arrows indicate the flow of materials and dashed arrows indicate the flow of information within the system.