Process Flow Diagrams
While cryopreservation of aquatic species was first reported more
than 60 years ago, germplasm repositories are not widely used in any aquaculture industry
(Yang et al., 2021; Yang & Tiersch, 2009). A disconnect exists between developing research-level
cryopreservation protocols for a species and implementing cryopreservation and repository
storage on a commercial scale. Protocols often lack reproducibility, do not consider quality
management steps, and were not developed to meet the needs of commercial industry.
For repository development in aquaculture industries to be successful, tools from the field
of industrial engineering can be used to standardize, improve, and scale up research-level
cryopreservation protocols into commercial-scale cryopreservation pathways.
Industrial engineering studies the interaction of people, materials, and equipment to design,
develop, or improve production systems (Lo & Sculli, 1995; Salaam et al., 2012). One key tool
used in industrial engineering is process flow mapping; commonly used in industrial engineering
to illustrate and understand all steps in a specific process (Renger et al., 2016).
These diagrams display the sequence of activities (steps) used to produce a product and allow
users to track how materials flow through the process (Damelio, 2011). Process flow diagrams
are often applied in commercial-scale factory settings to help identify and eliminate wastes
and bottlenecks, improving the process (Damelio, 2011; Diego Fernando & Rivera Cadavid, 2007).
In the context of developing repositories, process flow diagrams can be used to outline a
cryopreservation pathway (Figure 1).
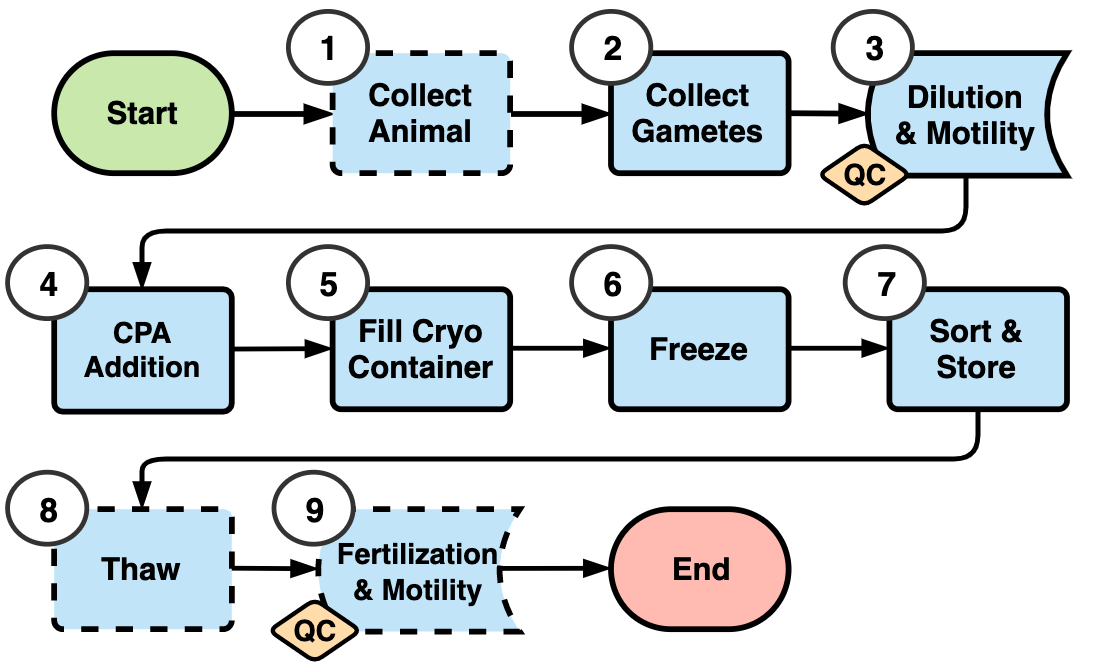
Figure 1. A pathway-level process flow diagram that outlines all the steps, in sequence, of a generalized cryopreservation process. Boxes with solid lines indicate steps in the cryopreservation pathway that take place on the same day that samples are frozen. Boxes with dashed lines indicate steps in the cryopreservation pathway that can take place in the days before or after freezing. Of special importance are the numbered steps that can be timed. Diamonds indicate Quality Control (QC) steps, and arrows indicate the flow of materials through the steps.
To create a process flow diagram, identify and define all the steps of the process, including the start and end points of each step. Next arrange the steps in the sequence they occur. A helpful exercise when identifying, defining, and ordering steps is to perform the process yourself or observe someone performing it. This ensures no steps are left out, helps define boundaries between steps, and confirms that the sequence of steps is correct. After the sequence has been confirmed, the process flow diagram can be created by visually representing each step in order on the diagram. Process flow diagrams can be drawn or created on software such as draw.io. In general, oval shapesindicate the start and end of the entire process, rectangles represent individual steps, and diamonds represent decision points (Damelio, 2011). Arrows connect steps and show the flow of material and information through the process. Guidelines exist that explain the accepted meanings of the different symbols used in process flow diagrams (online resource). After the process flow map has been created (Figure 2), it can be studied to understand the process, identify bottlenecks, and plan improvements (Damelio, 2011). Process flow diagrams can also be used to generate quantitative data as well when used in combination with other common industrial engineering tools, such as time studies and discrete-event simulation (DES) modeling (described in the next section).
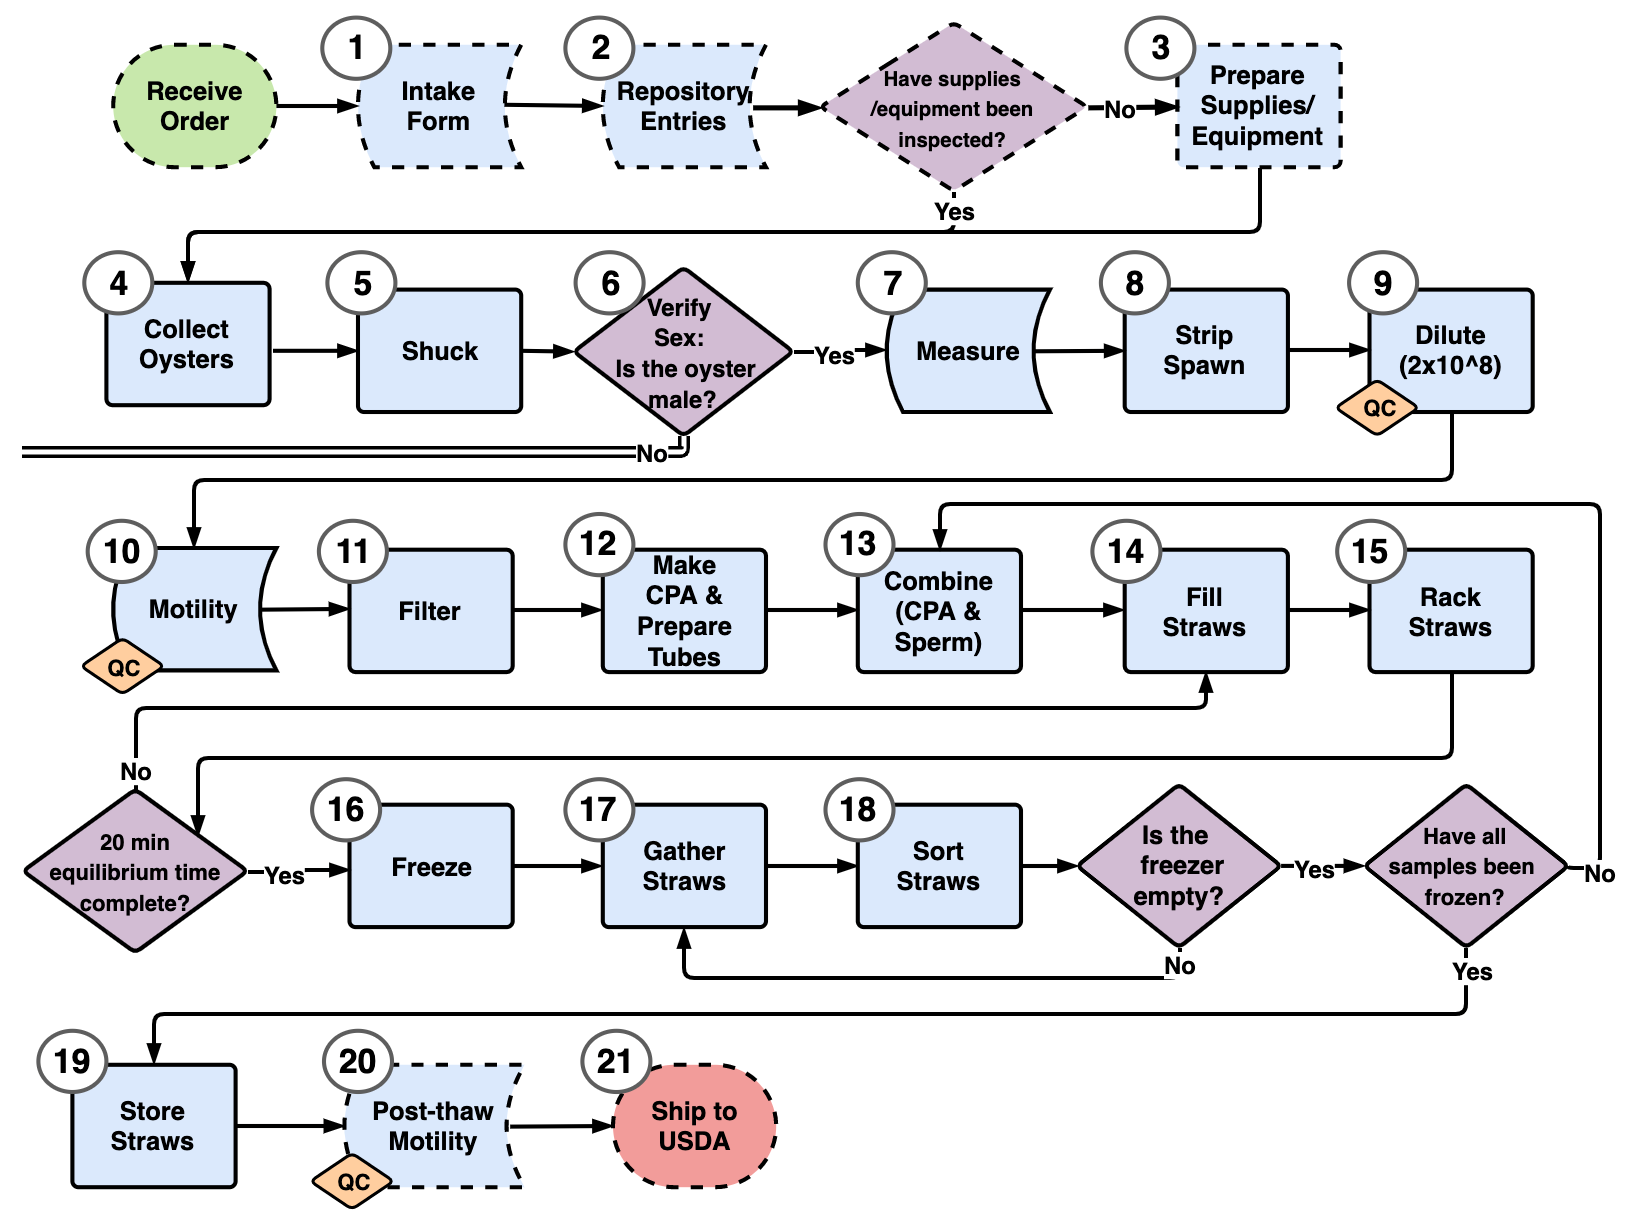
Figure 2. Process flow map of the high-throughput oyster cryopreservation protocol used in this study. Oval shapes represent the start and end steps in the protocol, rectangles indicate steps in the protocol, rectangles with curved sides indicate steps where data was recorded, large diamonds indicate quality assurance (QA) steps, and small diamonds indicate recorded quality control (QC) measurements. Steps with dashed outlines were not required to be performed on the same day as steps with solid outlines. Single-line arrows indicate the flow of material, whereas double-line arrows indicate material was removed from the system. Numbers indicate steps that were measured during time studies. This study addressed Steps 4–19. Steps in this map can be customized for any process. CPA is an abbreviation for cryoprotective agent. (source: Bodenstein et al., 2022).